Metrics · AI · Startups
Revenue Per Employee Measures What You Moved Off Payroll
OnlyFans beats Anthropic at $33M revenue per employee with 47 staff. The metric rewards what left your payroll, not what your team built.
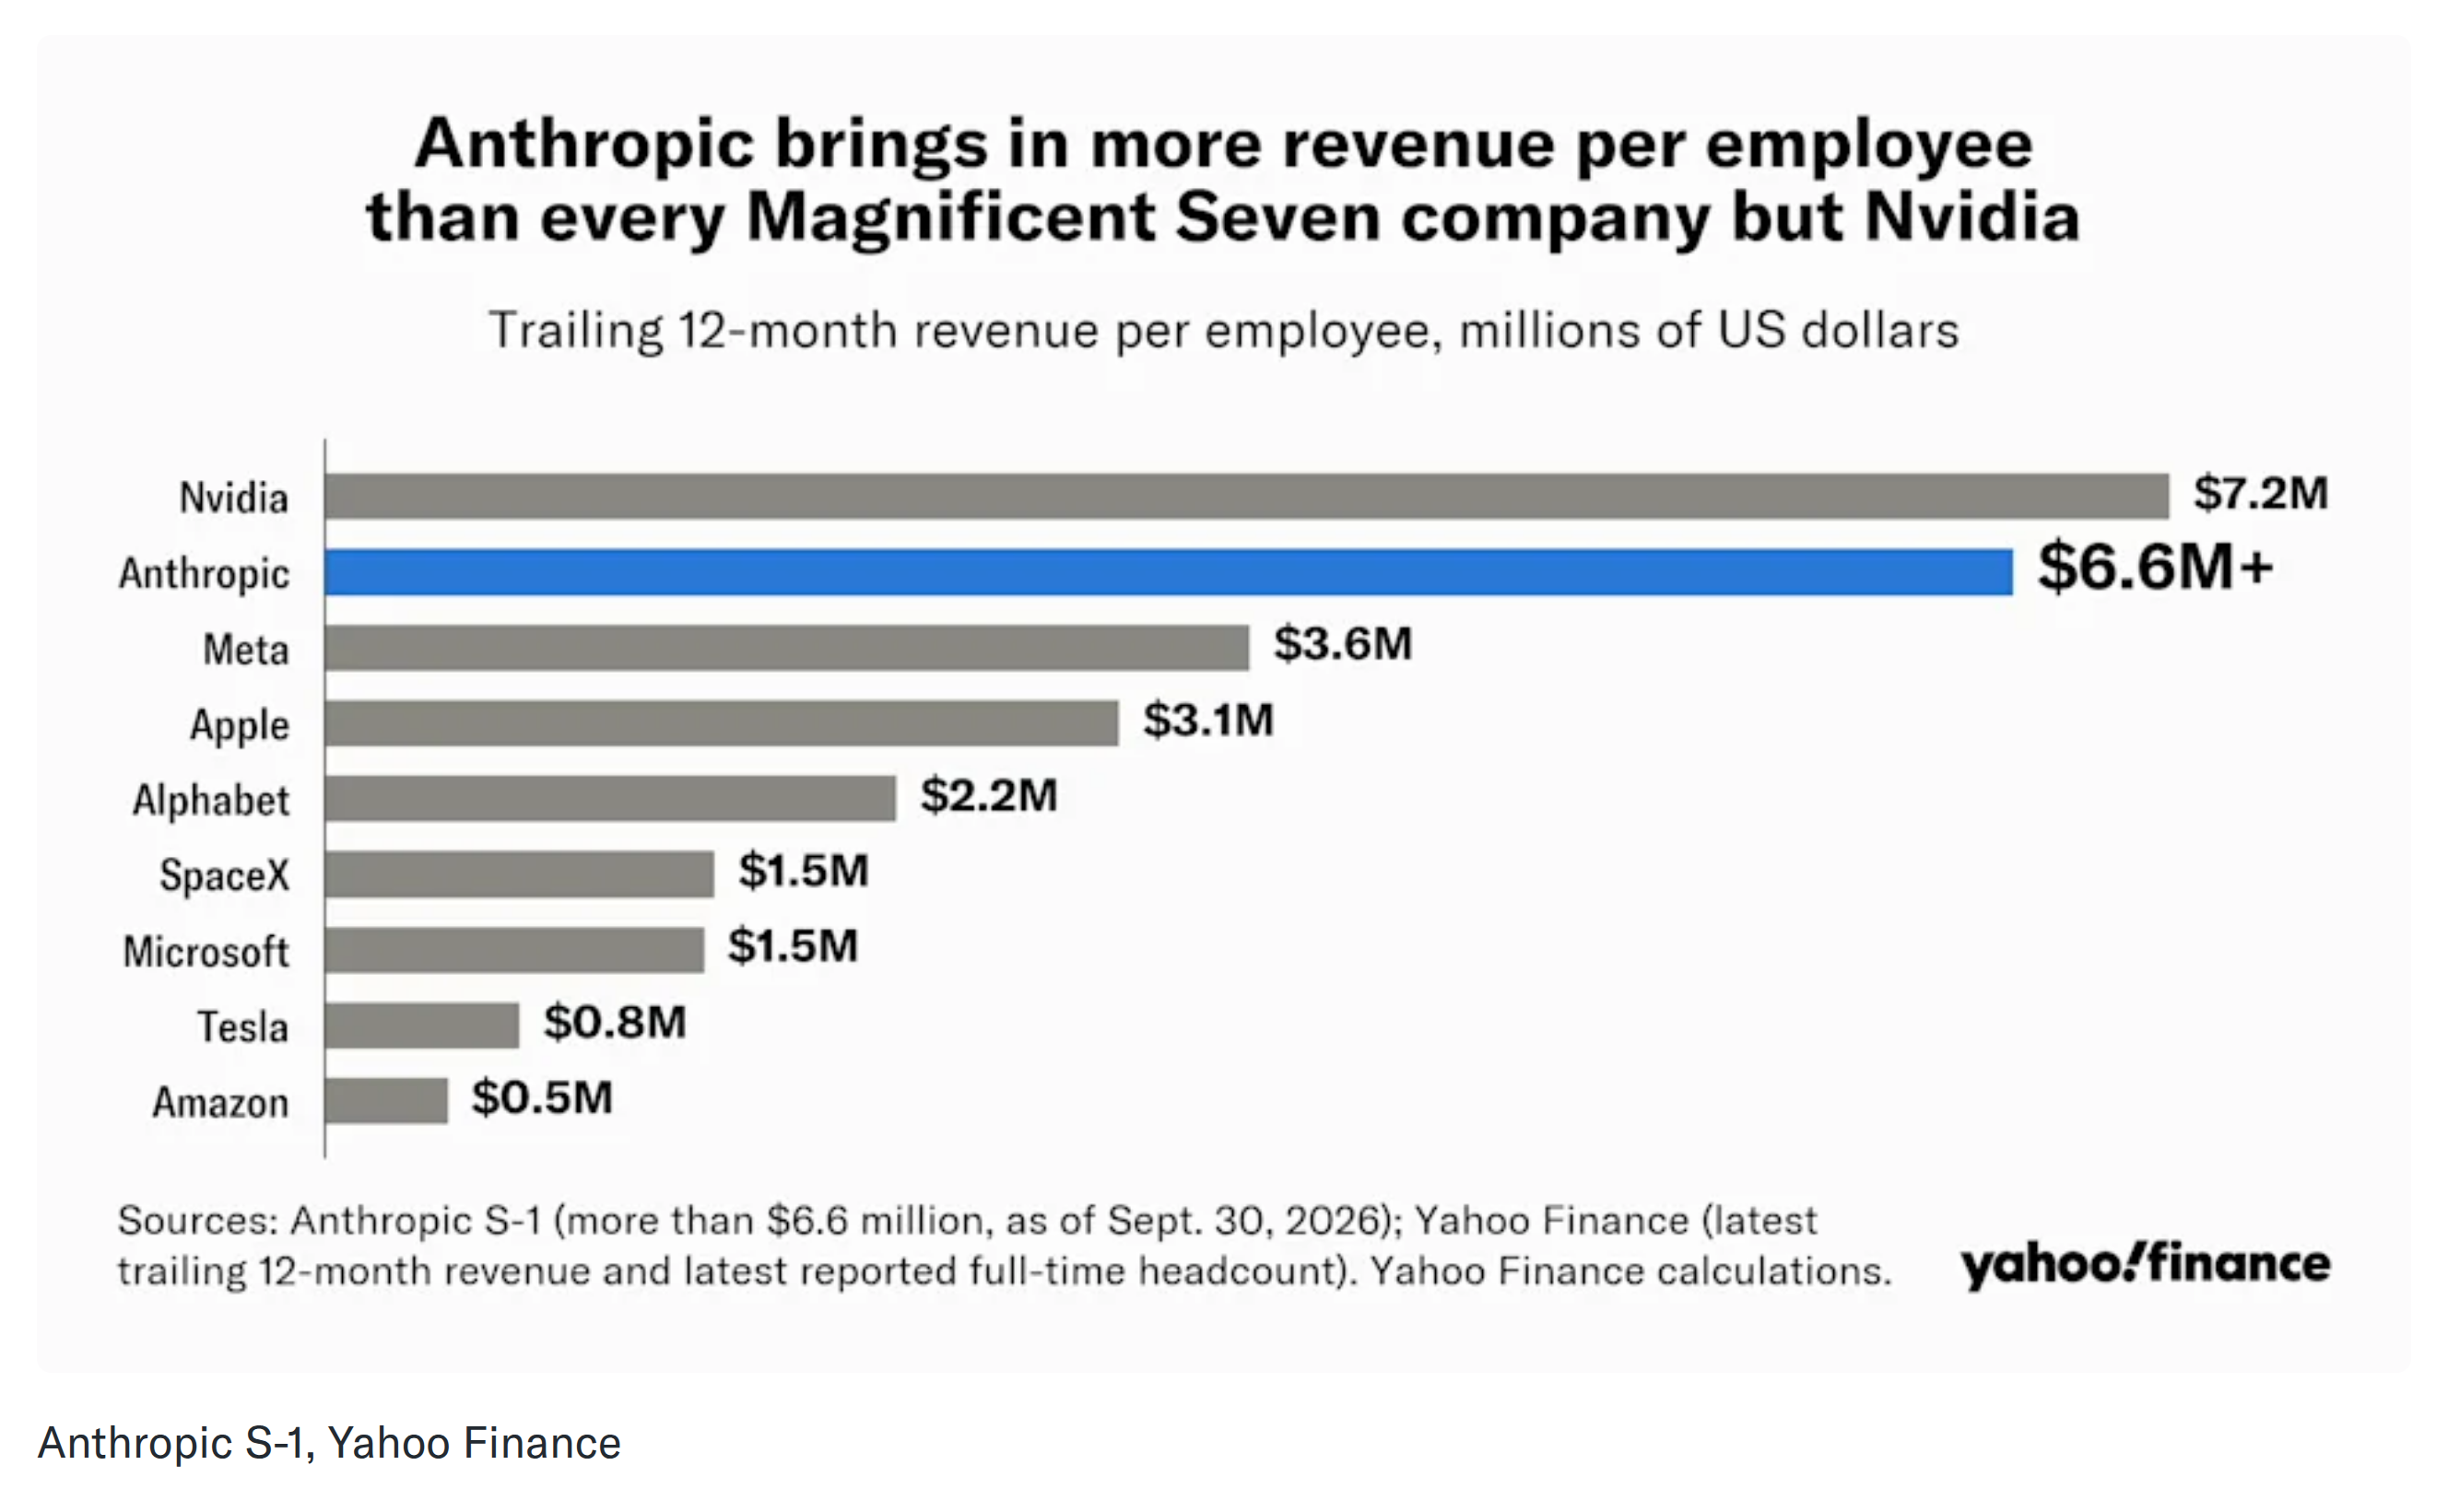
Anthropic filed its S-1 on 26 October, and buried in it is a number built to be quoted: with approximately 5,300 employees, trailing-twelve-month revenue per employee of over $6.6 million. More than Meta, Apple, Alphabet, Microsoft and Amazon. Yahoo Finance charted it the same day. If you run a company, you felt exactly what that sentence was engineered to make you feel — this is what AI leverage looks like.

Now guess which company beats it.
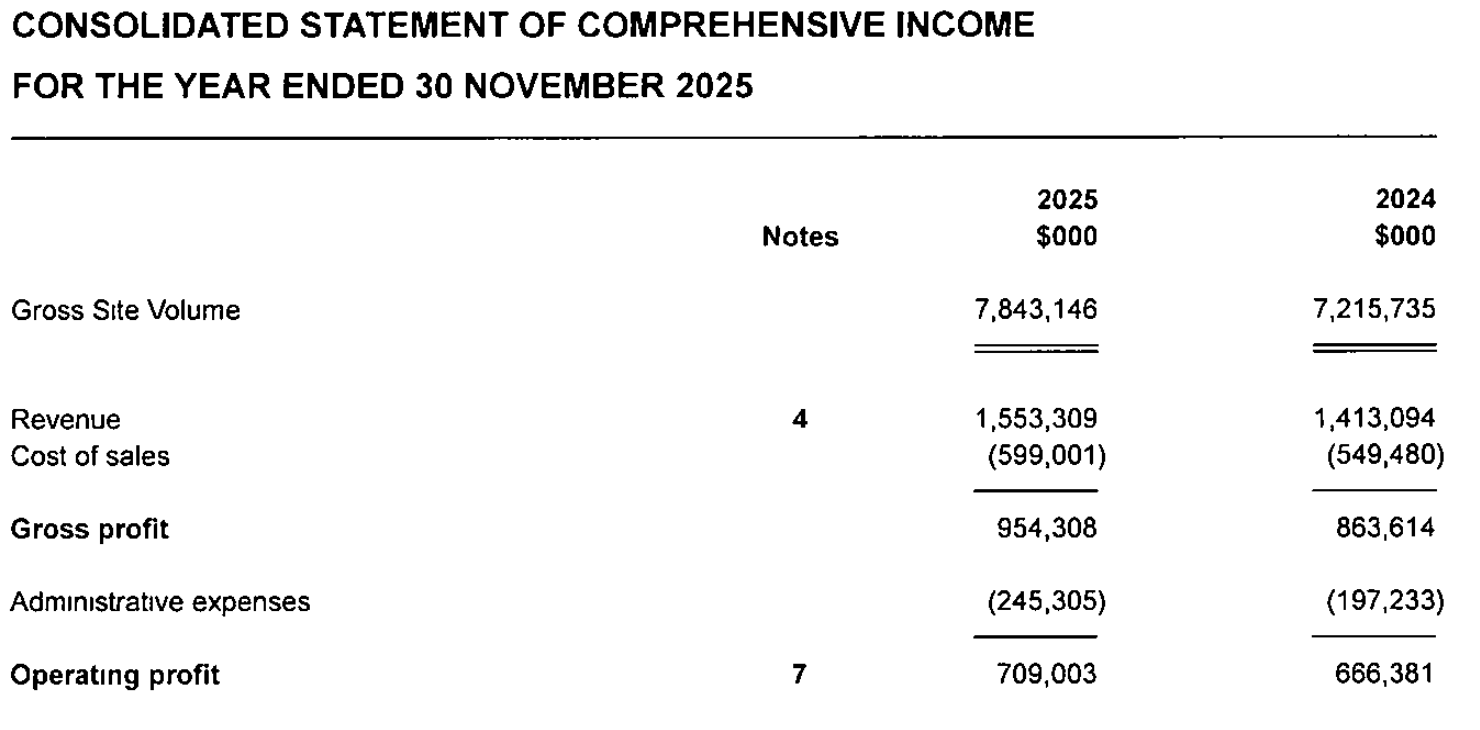
Not Google. Not anything in that chart. It is a 47-person company registered in London whose accounts anyone can download from Companies House for free: Fenix International Limited, the owner of OnlyFans. Revenue of $1,553,309 thousand for the year ended 30 November 2025, average monthly headcount of 47. That is $33 million of revenue per employee — five times Anthropic, from two numbers in the same filing.
The ranking is entertaining. What the metric rewards is the problem.
The ratio is scoring 5% of your spending
OnlyFans' entire payroll in 2025 was $46.8 million. Its operating cost base — cost of sales plus administrative expenses — was $844.3 million. Payroll is 5.5% of what the company spends.
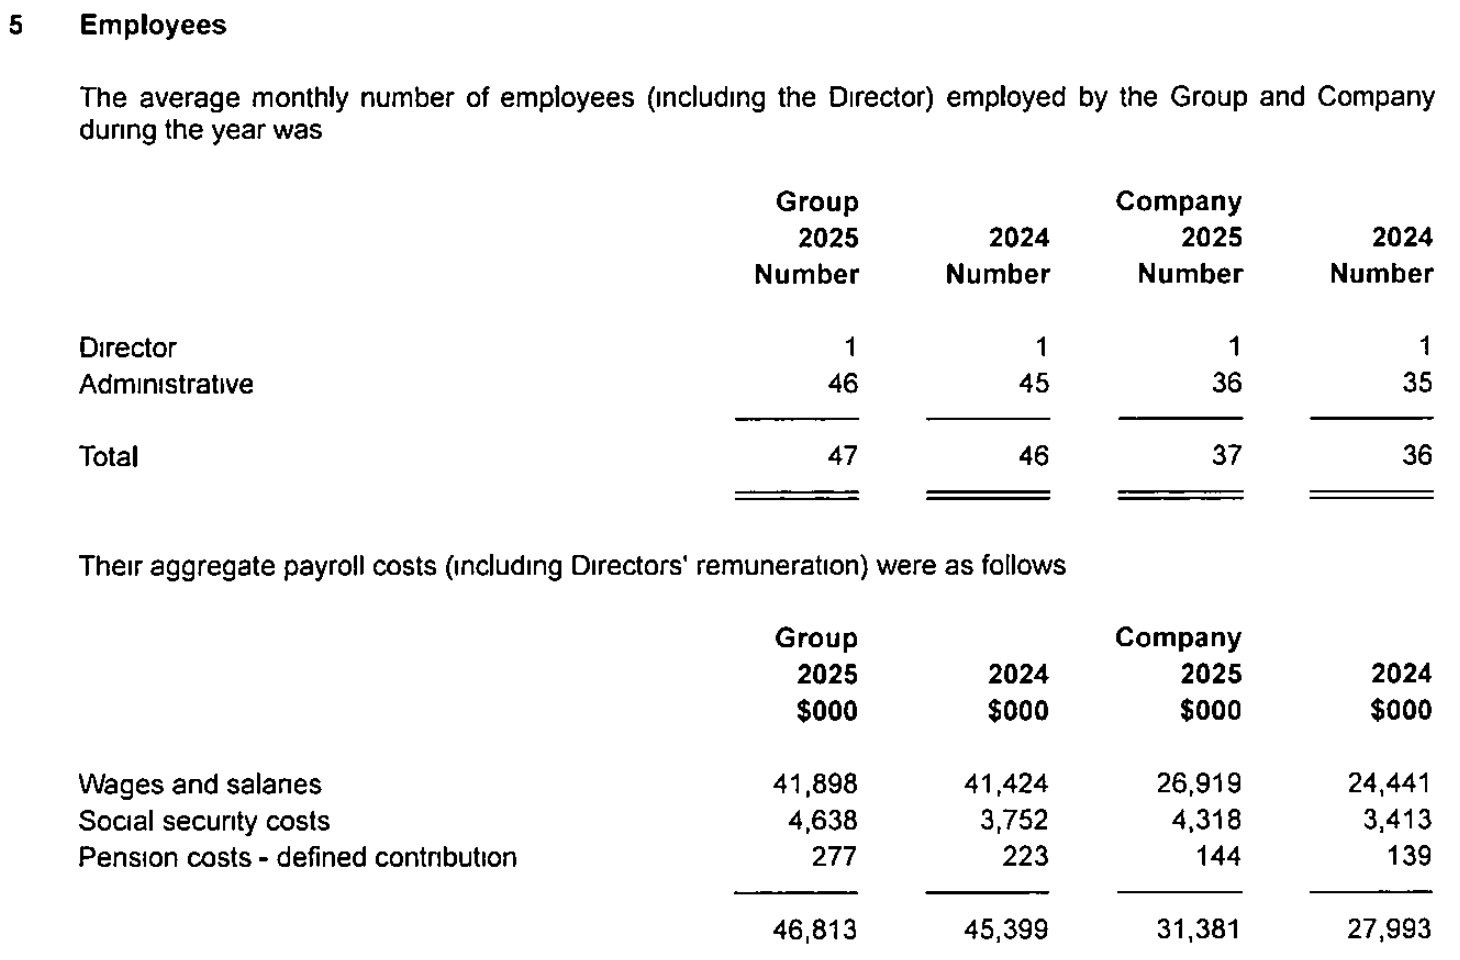
Revenue per employee is a ratio whose denominator covers a twentieth of the cost base. Adopt it as an internal target and you are managing that twentieth while the other nineteen — vendors, compute, transaction fees, managed platforms — stays invisible to the number you steer by.
Worse, it improves every time work leaves the payroll. Move a function to a contractor, a usage-priced API or a managed service and the ratio goes up, whether or not the company got cheaper, faster or better. Freeze headcount while your compute bill compounds and you will make the number excellent and the company worse. That is the cost of adopting it: you optimise the smallest line in your P&L and call the result productivity.
Which of these numbers you can actually check
They are not the same kind of fact, and that matters more than the order they sit in.
The OnlyFans figures are audited group accounts filed at Companies House. Gross site volume, revenue, cost of sales, payroll, headcount — all line items in a 45-page document, and the $33 million is arithmetic on two of them.
Anthropic's $6.6 million is a different object. It is the company's own figure, in its own registration statement, under the heading "Operating Efficiency", presented to investors as a reason to buy. And the filing does not disclose what you would need to check it: every Q3 2026 revenue figure in the S-1 is a blank.

The table circulating this week — OnlyFans ahead of Anthropic, Nvidia, Netflix, Meta, Apple, Google, Microsoft and Palantir — came from a social post, not a publisher, and its rows are computed on different fiscal years and different bases. Nvidia is $7.2 million on Yahoo Finance's trailing-twelve-month basis and $5.14 million on its own FY2026 10-K ($215,938 million over approximately 42,000 employees). Epoch AI put Anthropic at $9.0 million in May using annualised run-rate; the S-1 says $6.6 million on TTM. Same company, two bases, two answers. The Netflix and Palantir entries could not be anchored to a primary source, so they are not in this post.
The rule that removes five million people from the fraction
OnlyFans' income statement opens with a line most companies do not have. Gross site volume: $7,843,146 thousand. Immediately below it, revenue: $1,553,309 thousand. The $6.29 billion in between goes to creators, and it never appears as a cost, because it never enters the statement at all.
The filing says it plainly: revenue "is recognised on a net basis", and "the portion of the gross amount billed to end users that is allocated to Creators is not reflected as revenue." That is IFRS 15 working as designed — the company is an agent rather than the principal, so it books the commission, not the gross.
Follow what that does to the ratio. The accounts report 5,063,000 creator accounts. Those people make the product. They are not in the denominator, because they are not employees. They are also not in the numerator's cost base, because the rule keeps their $6.2 billion off the income statement. The largest flow of money in the business is absent from both halves of the fraction. (OnlyFans is also reported to contract around 1,500 external content moderators. That figure is not in the Companies House filing and could not be confirmed at its source, so treat it as reported, not established.)
Cost of sales, in the filing's own definition, is "payments for hosting, website maintenance, and payment transaction fees". Infrastructure and payment processing. Not people.
The same shape shows up in the companies people take more seriously. Anthropic's S-1 says substantially all of cost of revenue is compute and infrastructure, and describes its largest expense line — research and development, $9,741 million of $16,979 million in the first half of 2026 — as consisting primarily of compute, with personnel named afterwards. Nvidia's 10-K states it is fabless; TSMC's 20-F reports 90,557 employees, none of whom are among Nvidia's 42,000.
Where the easy version of this argument breaks
"The metric only rewards externalisation" is too strong, and Anthropic's own numbers break it. Headcount went from approximately 940 at the end of 2024 to approximately 5,300 in September 2026 — 5.6x — while the ratio grew roughly 4.7x. Revenue went $41 million, $386 million, $4.6 billion, then $16.3 billion in six months. That is not a denominator trick. Something real happened.
The defensible claim is narrower and more useful: revenue per employee cannot distinguish leverage you built from work you bought. Yahoo Finance's own article makes half the point in one line, noting that Anthropic rents most of its computing, "so many of the people running its data centers work for Google and Amazon."
AI makes the confusion structural. "Claude wrote it" and "a vendor ran it" are the same movement in this ratio, and from outside the company they are indistinguishable. Anthropic reports that over 90% of contributions to its codebase in September 2026 were written by Claude — an internal measurement with no published methodology. Whether that is leverage or substitution, the ratio does not say.
What to put in the board deck instead
Measure cost per unit of delivered output across the whole cost base, not revenue per head. Then label every improvement as one of three things:
- Leverage you built — the same people produce more because of something you own. This compounds.
- Work you bought — a vendor, an API, a managed service does it now. A real decision, with a bill that grows with usage.
- Work somebody else does for free — users, creators, an ecosystem. The best of the three when it is true, and the easiest to mistake for the first.
Three questions before the ratio goes in front of a board. What share of our cost base is payroll — and if it is under 20%, why are we steering by headcount? If headcount froze and the number improved, which of the three above caused it? And if nobody can say which, you have a reporting problem, not a productivity win.
This is the same reasoning we bring when we take AI-built software to production: the question is never how few people touched it, but what the delivered thing costs to run and who is on the hook when it breaks. We have written before about keeping AI-written code contained and about reading the stated reasons behind AI layoffs. Both are versions of this mistake — letting a headcount number stand in for an operating one.
Key takeaways
- OnlyFans' $33M revenue per employee is arithmetic on audited accounts: $1,553,309k of revenue over 47 average monthly employees.
- Anthropic's $6.6M is the company's own figure in its own S-1, and that filing leaves the revenue needed to verify it blank.
- Payroll is 5.5% of OnlyFans' operating cost base, so the ratio's denominator covers a twentieth of what the company spends.
- IFRS 15 net presentation keeps $6.29bn of creator payments off the income statement, so the people who make the product sit in neither half of the fraction.
- The metric cannot separate leverage you built from work you bought — and with AI, those look identical from outside.